
CSAT: how to measure customer satisfaction and what a good score is | Ribbo AI

The CSAT formula, a worked example with real arithmetic, how many responses you need before a change means anything, why published benchmarks mislead, and the fixes that move the score.
CSAT, short for customer satisfaction score, is the share of customers who say they were satisfied with a specific interaction. You ask one question straight after a conversation, delivery or visit ("How satisfied were you with the help you received?") on a 1 to 5 scale, then divide the number of 4s and 5s by the total number of responses.
The arithmetic takes ten seconds. The hard parts are elsewhere: asking at the right moment, collecting enough responses for the number to mean something, comparing it honestly, and turning the low ratings into fixes. This guide covers each, with a worked example you can check against our free CSAT calculator.
The CSAT formula
The standard version counts the top two boxes on a five-point scale:
CSAT (%) = (responses of 4 + responses of 5) / total responses x 100Some teams report the average rating instead:
Average rating = (1 x n1 + 2 x n2 + 3 x n3 + 4 x n4 + 5 x n5) / total responsesBoth are legitimate. They are different numbers for the same survey, so pick one, write it into your dashboard definition, and never compare one team's percentage with another team's average. The CSAT glossary entry gives the short definition; the rest of this guide is the long one.
Worked example
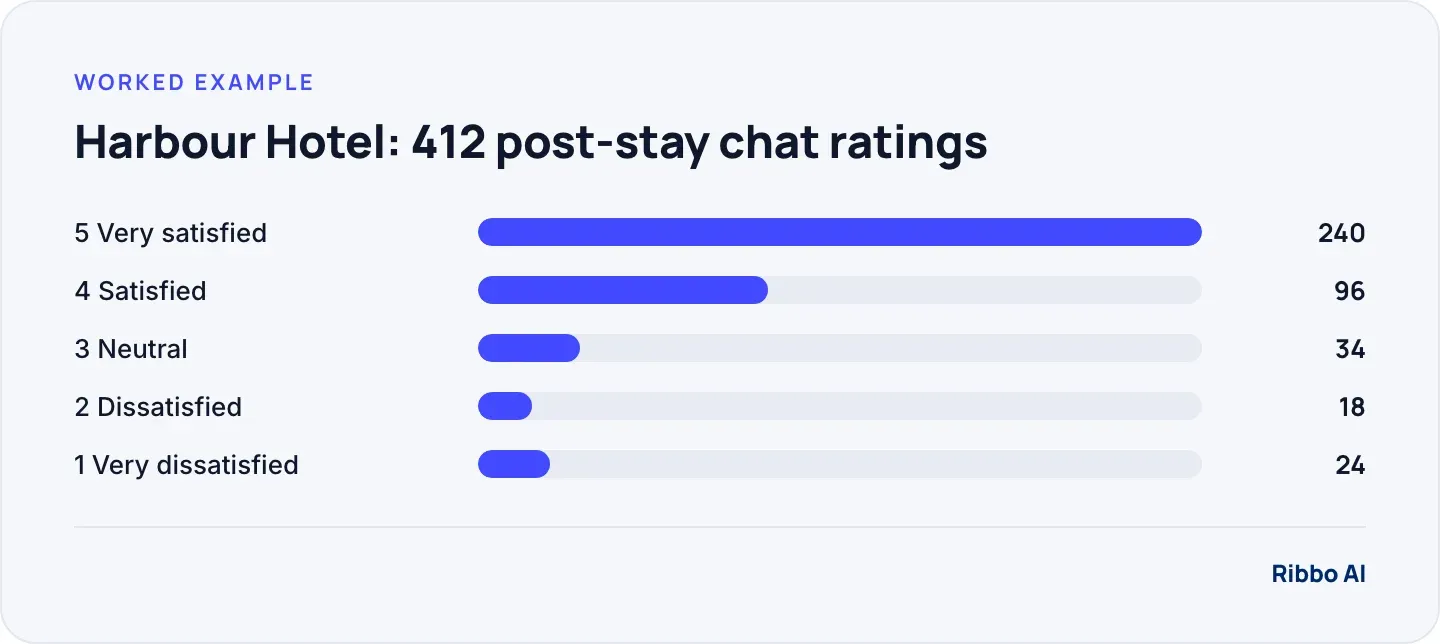
Harbour Hotel, a fictional 120-room property, asks every guest who messages its front desk on WhatsApp to rate the help they got. In September it collected 412 ratings:
| Rating | Responses | Share |
|---|---|---|
| 5 Very satisfied | 240 | 58.3% |
| 4 Satisfied | 96 | 23.3% |
| 3 Neutral | 34 | 8.3% |
| 2 Dissatisfied | 18 | 4.4% |
| 1 Very dissatisfied | 24 | 5.8% |
| Total | 412 | 100% |
- Satisfied responses: 240 + 96 = 336.
- CSAT: 336 / 412 x 100 = 81.6%.
- Average rating: (240 x 5 + 96 x 4 + 34 x 3 + 18 x 2 + 24 x 1) / 412 = 1,746 / 412 = 4.24 out of 5.
- Dissatisfied share (1s and 2s): 42 / 412 = 10.2%.
Report the dissatisfied share next to CSAT. Two teams can both sit at 81.6% while one has 4% unhappy customers and the other has 12%, depending on how many neutrals there are. The unhappy group is the one that complains, churns and leaves reviews.
How many responses you need before CSAT means anything
A CSAT score is an estimate from a sample, so it carries a margin of error. For a percentage, the 95% margin is roughly:
Margin of error = 1.96 x square root( p x (1 - p) / n )
p = CSAT as a decimal, n = number of responses
For Harbour Hotel, p = 0.816 and n = 412, which gives 1.96 x square root(0.150 / 412) = 0.037. The true score is probably between 77.9% and 85.3%. With fewer responses the band widens fast.
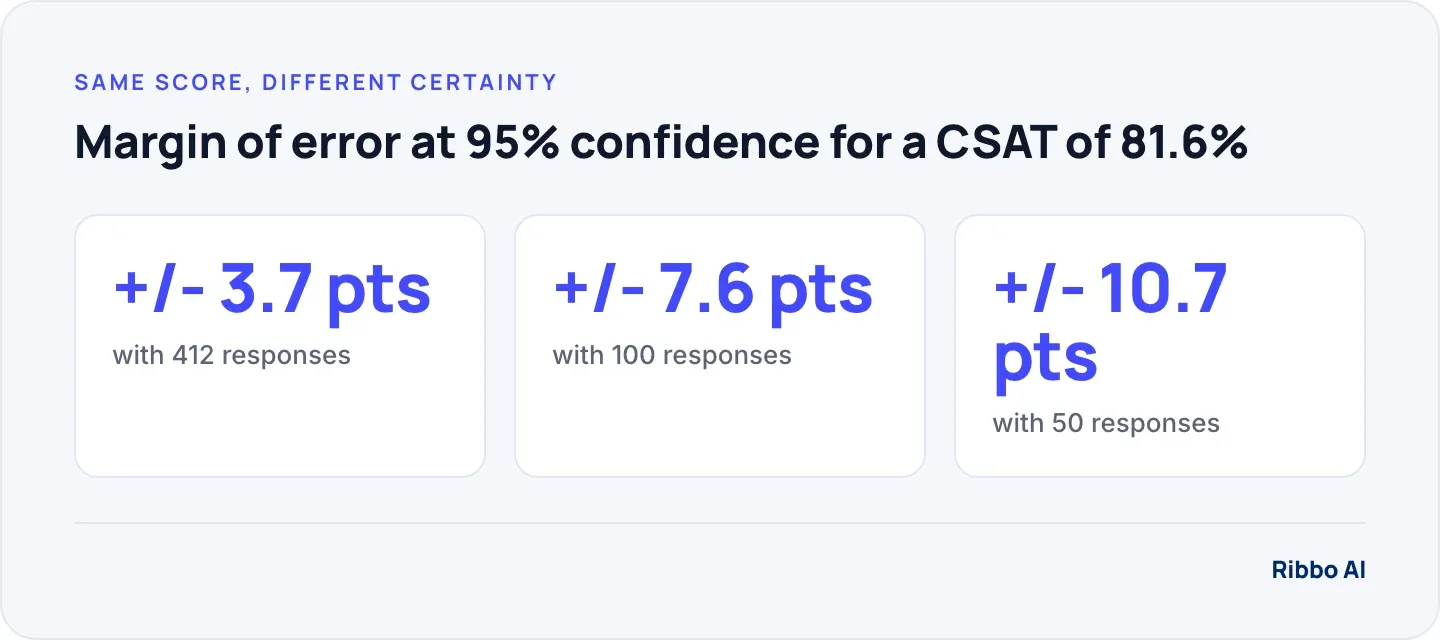
Turn the formula round to plan your sample. To know CSAT within plus or minus 5 points when it sits near 80%, you need about 1.96 squared x 0.8 x 0.2 / 0.05 squared = 246 responses. Within 3 points you need about 683. A small team getting 40 ratings a week should report CSAT monthly and should treat a one-week dip of five or six points as a reason to read the comments, not as a trend.
The formula assumes the people who answer are like the people who did not. They usually are not: very happy and very unhappy customers answer more often than indifferent ones. You cannot calculate that bias away, so keep your survey method fixed from month to month, and the bias stays roughly constant. Changing the channel or timing of the survey resets your baseline.
How to design a CSAT survey people answer
The survey itself shapes the score more than most teams realize. Six decisions matter.
- Ask about one interaction. "How satisfied were you with the help you received today?" CSAT measures a moment. Questions about the brand as a whole belong in NPS.
- Ask straight away. At the end of the chat, or within a day of the call or delivery. A week later the customer is rating their memory of it.
- Label both ends of the scale. "1 = very dissatisfied, 5 = very satisfied." Without labels some customers read 1 as best.
- Ask in the same channel. A WhatsApp conversation gets a WhatsApp question, a web chat gets an inline rating. Sending an email survey after a chat cuts responses and skews them toward people who check email.
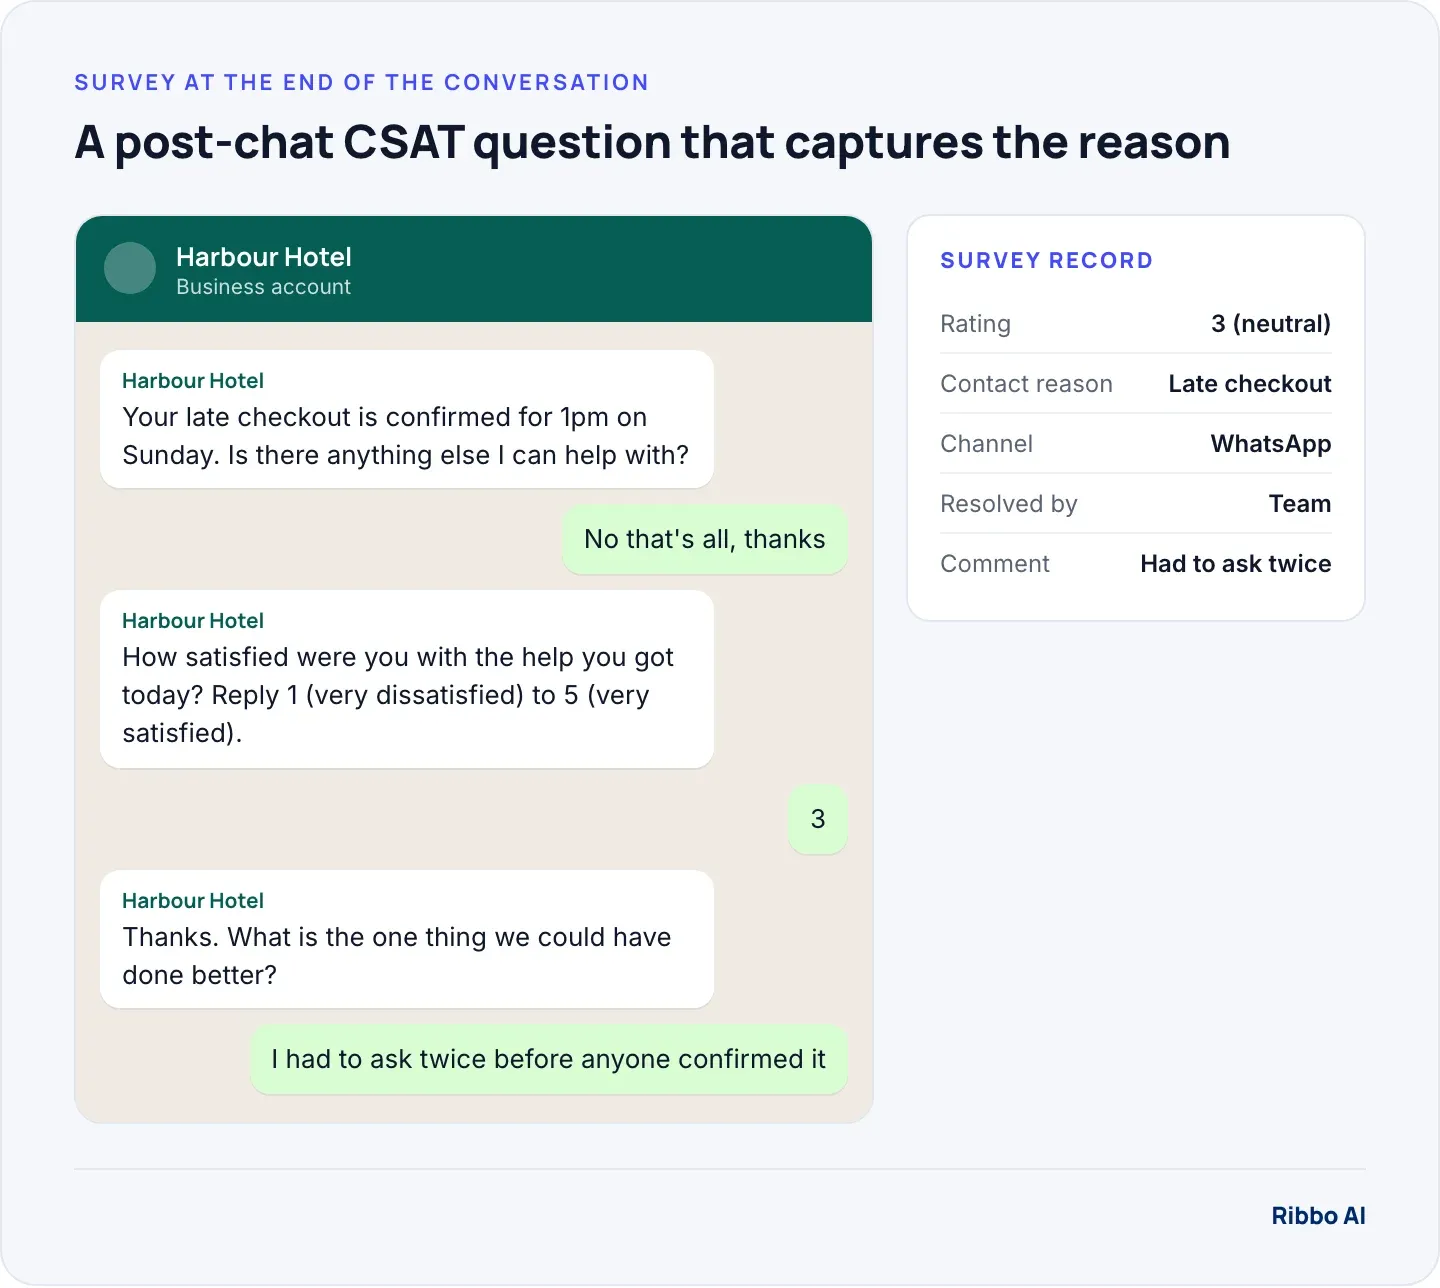
- Add exactly one follow-up. "What is the one thing we could have done better?" for scores of 1 to 3, and optionally "What went well?" for 4 and 5. That comment is worth more than the number.
- Save the context with the rating. Contact reason, channel, who resolved it (the AI agent or a person) and whether it was handed over. Without these, you have a score and no way to act on it.
If you want the wider picture of when to survey, how long to make it and which questions to add, our guide to the customer feedback survey covers design end to end.
What is a good CSAT score?
The honest answer is that a good CSAT score is one that is higher than your own last quarter, measured the same way. Published CSAT benchmarks are a weak guide, for four reasons.
- Different formulas. One company's "CSAT 85" is a top-two-box percentage, another's is an average rating of 4.25 multiplied by 20, and a third uses a 1 to 10 scale.
- Different indexes. The best-known national figure, the American Customer Satisfaction Index, is a different measure altogether. ACSI describes its score as a weighted average of three survey questions, with the weights estimated by its own model, on its methodology page. It is useful for tracking an industry over time and not comparable with a one-question post-chat survey.
- Different moments. A survey sent only on resolved tickets scores higher than one sent on every conversation. A survey sent after delivery scores the courier as much as the support team.
- Different mixes. A team handling mostly billing disputes will score below one handling mostly product questions, with identical service quality.
Use this method instead of chasing an industry number:
- Fix the definition: question wording, scale, timing, channel, and which conversations get surveyed.
- Collect three months at that definition to get a baseline, with the margin of error from the formula above.
- Break it down by contact reason and channel. The overall score hides everything; a reason with 60% CSAT next to one with 92% tells you where to look.
- Set targets per reason, based on what your best reason already achieves. If delivery questions score 92%, refund questions scoring 61% is a process problem you can close.
- Review the 1s and 2s weekly. Read every comment, tag the cause, and count the tags.
How to improve CSAT
When you tag the comments on low scores, most causes fall into a few buckets. Each has a different fix.
The customer had to come back
Repeat contacts are the most common reason for a low rating. SQM Group, which runs post-call surveys for contact centres, reports that every 1% improvement in first contact resolution brings a 1% improvement in customer satisfaction, in its write-up on what a good FCR rate is. Treat that as one research firm's finding rather than a law, but the direction matches what most teams see in their own data. Our glossary entry on first contact resolution explains how to measure it.
The customer had to work too hard
Repeating details after a transfer, switching from chat to email, being asked for an order number twice. Dixon, Freeman and Toman argued in Harvard Business Review in 2010 that reducing effort does more for loyalty than delighting customers. If effort is your main complaint theme, add a customer effort score question for a month to measure it directly.
The answer was right but the wait was long
Slow first replies drag CSAT down even when the resolution is good. Look at ratings by time to first reply: if conversations answered within five minutes score far higher than those answered after an hour, staffing or automation of the routine questions is the fix, not agent coaching.
The policy was the problem
Some low scores are about the outcome, not the service: the refund was declined, the item is out of stock. Tag these separately. They belong in a conversation with whoever owns the policy, and they should not count against an individual agent.
CSAT when an AI agent answers first
Once an AI agent handles part of your volume, split CSAT by who resolved the conversation: the agent on its own, the agent then a person, or a person from the start. The agent's containment rate only counts as a success if the contained conversations score as well as the ones people handled. If they score lower, look at the comments for invented answers, loops, or a missing route to a person.
Watch the handed-over group too. If customers rate the human part poorly because they repeated themselves after the handoff, the handoff is broken, not the agent or the team.
Where Ribbo fits
Ribbo AI records every conversation with its outcome: resolved by the agent, resolved by the team, or still open. Its analytics show volumes, response times, escalation reasons and the questions the agent could not answer, which is the context you need to explain a CSAT movement. To calculate the score itself from your own survey counts, use the free CSAT calculator, which shows the percentage, the average and the full split.
Frequently asked questions
Is CSAT the same as NPS?
No. CSAT asks how satisfied a customer was with one interaction, usually on a 1 to 5 scale. NPS asks how likely they are to recommend you, on 0 to 10, and measures the relationship as a whole. Many teams run CSAT after every conversation and NPS once a quarter.
Should 3 count as satisfied?
In the standard formula, no. Only 4 and 5 count. Whatever you choose, keep it fixed, because moving the 3s into the satisfied group can add ten points overnight without any customer being happier.
How do I calculate CSAT in Excel or Google Sheets?
If the ratings are in column B, use =COUNTIF(B:B,">=4")/COUNT(B:B) and format the cell as a percentage. For the average rating, use =AVERAGE(B:B).
Should I survey every conversation?
Survey every conversation that reached an end, including ones the AI agent resolved, and do not filter to resolved tickets only. Filtering raises the score and hides the conversations customers were least happy with.
What response rate should I expect?
It depends heavily on channel and timing, and no published figure transfers well between businesses. An in-chat question asked at the end of the conversation gets far more answers than an email sent the next day. Measure your own rate and watch it; a falling response rate can move CSAT as much as service quality does.